01
🔭 OpenTelemetry Tracing — See Inside Every Agent Turn
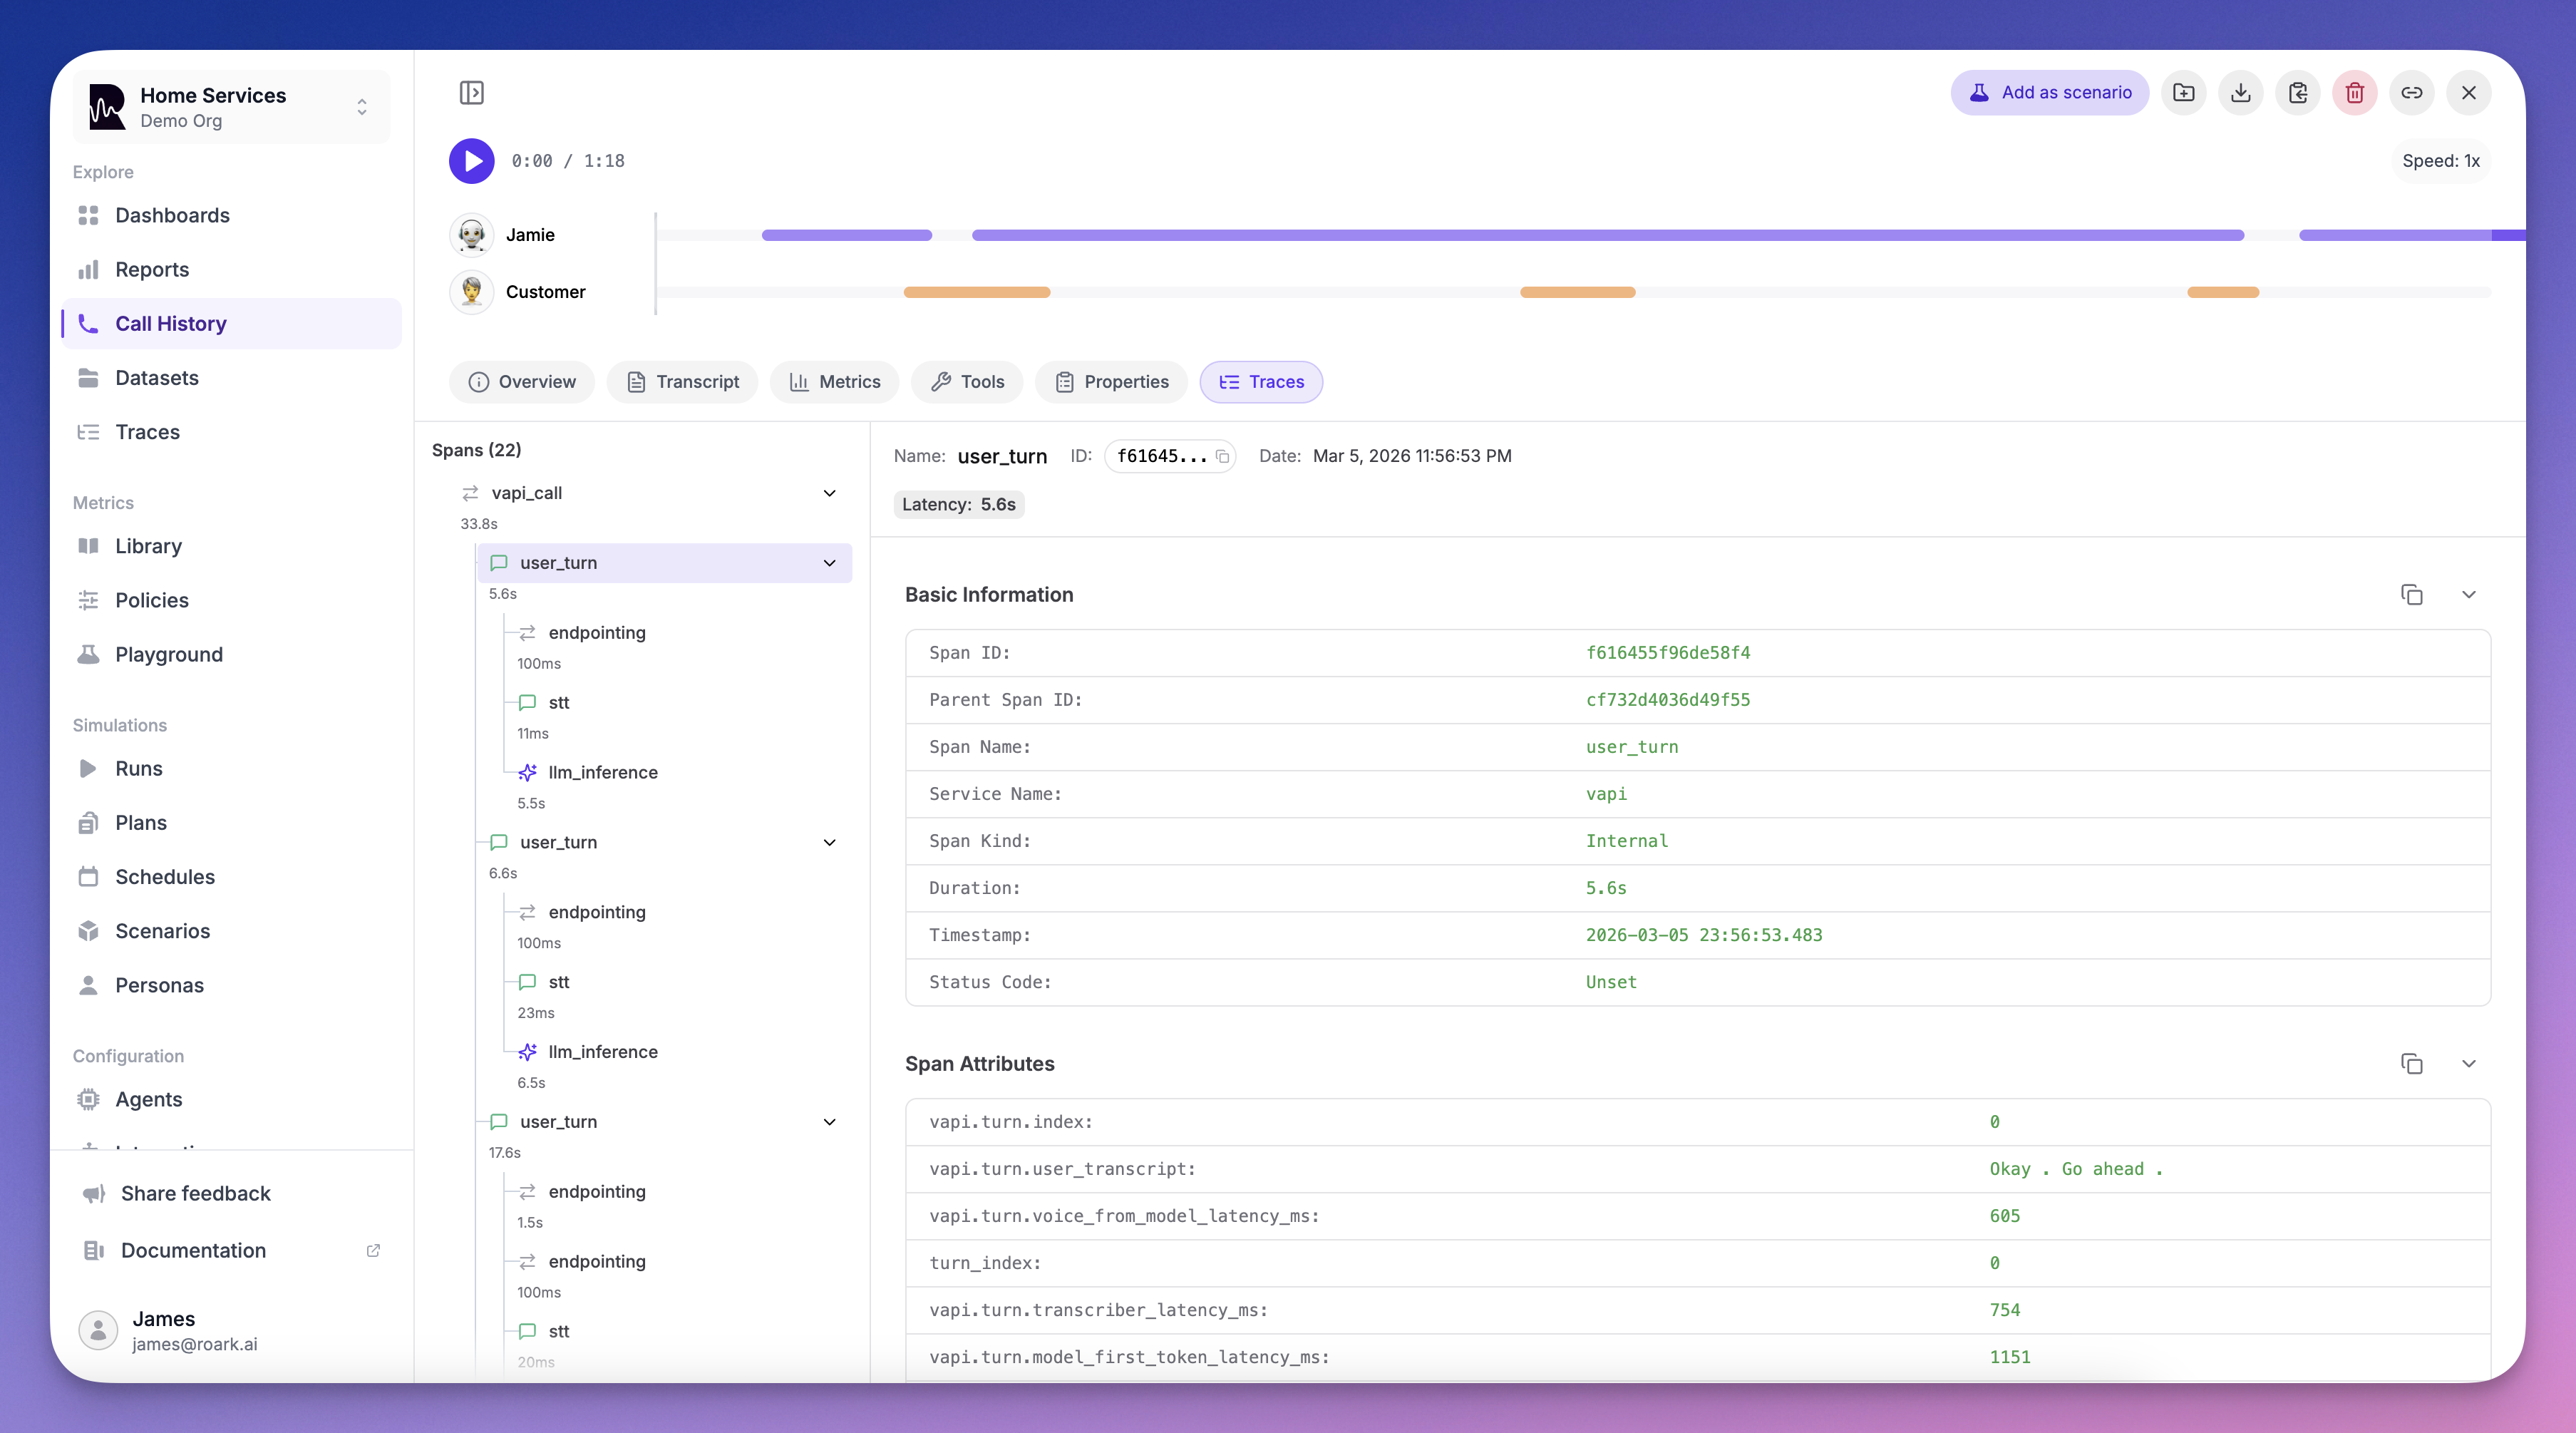
You can now send OpenTelemetry traces to Roark and see exactly what happens inside every turn of your voice AI agent — every STT transcription, every LLM generation, every TTS synthesis, every tool call — with full timing, hierarchy, and context.
Zero-config for Vapi. One function call for LiveKit. Works with anything.
- Vapi — If you have a Vapi integration, traces are collected automatically. No code changes, no exporters to configure. Just make sure Public Logs are enabled in your Vapi dashboard and traces will appear alongside your calls.
- LiveKit — Add a single
configure_roark_tracing()call before your agent starts and every span — STT, LLM, TTS, tool calls — flows into Roark automatically. - Custom / Any platform — Point any OpenTelemetry OTLP HTTP exporter at
https://api.roark.ai/v1/otel/v1/traceswith your API key. We support TypeScript, Python, Go, and any language with an OTel SDK.
What you get:
- Full turn-by-turn visibility — See exactly how STT, LLM, and TTS are used in each agent turn with span timings and hierarchy
- Latency debugging — Instantly spot slow LLM responses, TTS bottlenecks, or tool call delays
- Tool call inspection — See which tools were invoked, what arguments were passed, and how long they took
- Correlated with your calls — Traces appear on the Tracing tab of every call detail page, right next to transcripts and metrics
- Project-level trace explorer — Browse and search all traces from Observability → Traces
Roark acts as a full OTEL Collector — just send your traces and we handle ingestion, storage, and visualization.