Changelog

What’s new at Roark

Weekly product updates from the team. New features, integrations, and the occasional behind-the-scenes note.

Nº 30July 7 to 13, 2026

6 updates this week

This week we shipped the biggest update to Roark since we started: a ground-up rebuild of the platform, a rebuilt Simulations experience, and four new capabilities built on top of it. Everything below is live in production now.

✨ The New Roark Platform

We rebuilt the entire platform from the ground up around how you actually use it. Metrics are the center of gravity now, the AI agent is one keystroke away from any page, and the navigation, layout, and defaults all reflect a year of customer feedback.

The new Roark platform dashboard

What's different:

  • Simulations, rebuilt: a ground-up rebuild of how you test agents, now driven by Customer Flows with improv or scripted callers and ready-made templates (full details below)
  • Metric-first: every list, view, and detail page leads with the metrics that matter to you, not raw data you have to interpret yourself
  • Agent woven in: ⌘K opens an assistant that knows your project, your data, and your APIs
  • Saved views travel with you: column layouts, filters, and sorts persist per user, with inline Save and Discard when you make edits
  • Calmer, faster surfaces: switching projects no longer reloads the world, and the chrome got out of the way

This is the foundation we're building on for the rest of the year. Everything below shipped on top of it.

🎭 Simulations, Rebuilt

We rebuilt Simulations from the ground up for the new platform. Testing your agents against realistic callers is faster to set up, clearer to reason about, and now built around a new idea: Customer Flows.

Starting a simulation run from a template, with Flow adherence, Red teaming, and Conversation quality presets

What's new:

  • Customer Flows replace Scenarios: every simulated caller now runs on a Flow, the direct successor to Scenarios from the old app, with a cleaner model for how a call should unfold
  • Improv or Scripted: run an Improv flow where the simulated customer reacts naturally to whatever your agent says, or a Scripted flow where the call follows the exact turns you lay out. Choose per flow depending on whether you're stress-testing open-ended behavior or checking a known path
  • Templates to start fast: kick off from a library of ready-made flow templates instead of a blank page, so a useful simulation is minutes away

If you ran Scenarios in the old app, Customer Flows are where they live now, with the improv and scripted split layered on top.

🤖 In-app AI Assistant

You can now ask questions directly inside the platform and get answers pulled from your own data, without leaving the page you're on.

In-app AI assistant pinned to the right rail

What you can do:

  • Ask in plain English: "show me yesterday's failed calls" or "list my datasets" works out of the box, with the assistant calling the right API behind the scenes
  • Pinned to the right rail: hit ⌘K from anywhere, drag the edge to resize, the page stays visible and clickable underneath
  • Conversation history: every chat is saved, click History to jump back into a past thread
  • Streaming responses: tool calls and answers stream live so you see progress in real time

Read-only for now (lists, lookups, filters). Write actions land next.

📚 Knowledge Bases

You can now upload your own reference material into Roark and attach it to the metrics that need it. Give a judge metric the actual rubric, give a compliance metric the actual policy doc, and let the metric score against your source of truth instead of a prompt approximation of it.

Knowledge base attached to a metric's Reference Material section

Three ways to bring content in:

  • File: upload a PDF, .txt, or .md, PDFs get text-extracted automatically
  • Text: paste markdown or free-form text directly
  • JSON: paste structured data (taxonomies, decision trees, labeled examples)

Find Knowledge Bases under Configure, then attach one or many to a custom metric from the new Reference Material section in Studio. At eval time we transparently prepend the attached documents to the LLM as ground truth, then your prompt runs against them, no prompt rewriting required.

🔒 Fine-grained PII Redaction

You can now choose exactly which PII categories to redact from your calls, applied to both the audio and the transcript. Pick what's sensitive in your domain, leave everything else untouched.

Fine-grained PII redaction settings with per-category toggles

What you can redact:

  • Financial: credit card numbers, bank accounts, routing numbers
  • Government IDs: social security numbers, driver's license, passport
  • Contact: phone numbers, email addresses, physical addresses
  • Identity: names, dates of birth

Audio gets bleeped in place of the redacted span, transcripts get a [REDACTED:CATEGORY] marker, and the original never leaves the redaction step once it's enabled on a project.

🚗 In-Car Detection

A new system metric that flags when a caller is in a vehicle, both at the segment level and rolled up to the call. Useful for quality scoring, routing decisions, or just understanding the audio conditions your agents are working through.

In-car detection metric on a call detail view

What you get:

  • Boolean + confidence per segment: see exactly when in the call the in-car signal appeared
  • Call-level rollup: answers "did this happen at any point in the call", not diluted by quiet stretches
  • Powered by a zero-shot audio classifier running on the call recording, no agent-side instrumentation required
  • Lives in the new Call Environment package so future ambient-audio signals (hold music, background noise, road noise) slot in next to it

Off by default, enable it via a metric policy on the projects where it matters.

Nº 29April 3 to 3, 2026

🧮 Formula Metrics

🧮 Formula Metrics

You can now create Formula metrics that combine your existing metrics into composite scores and rules — no code required.
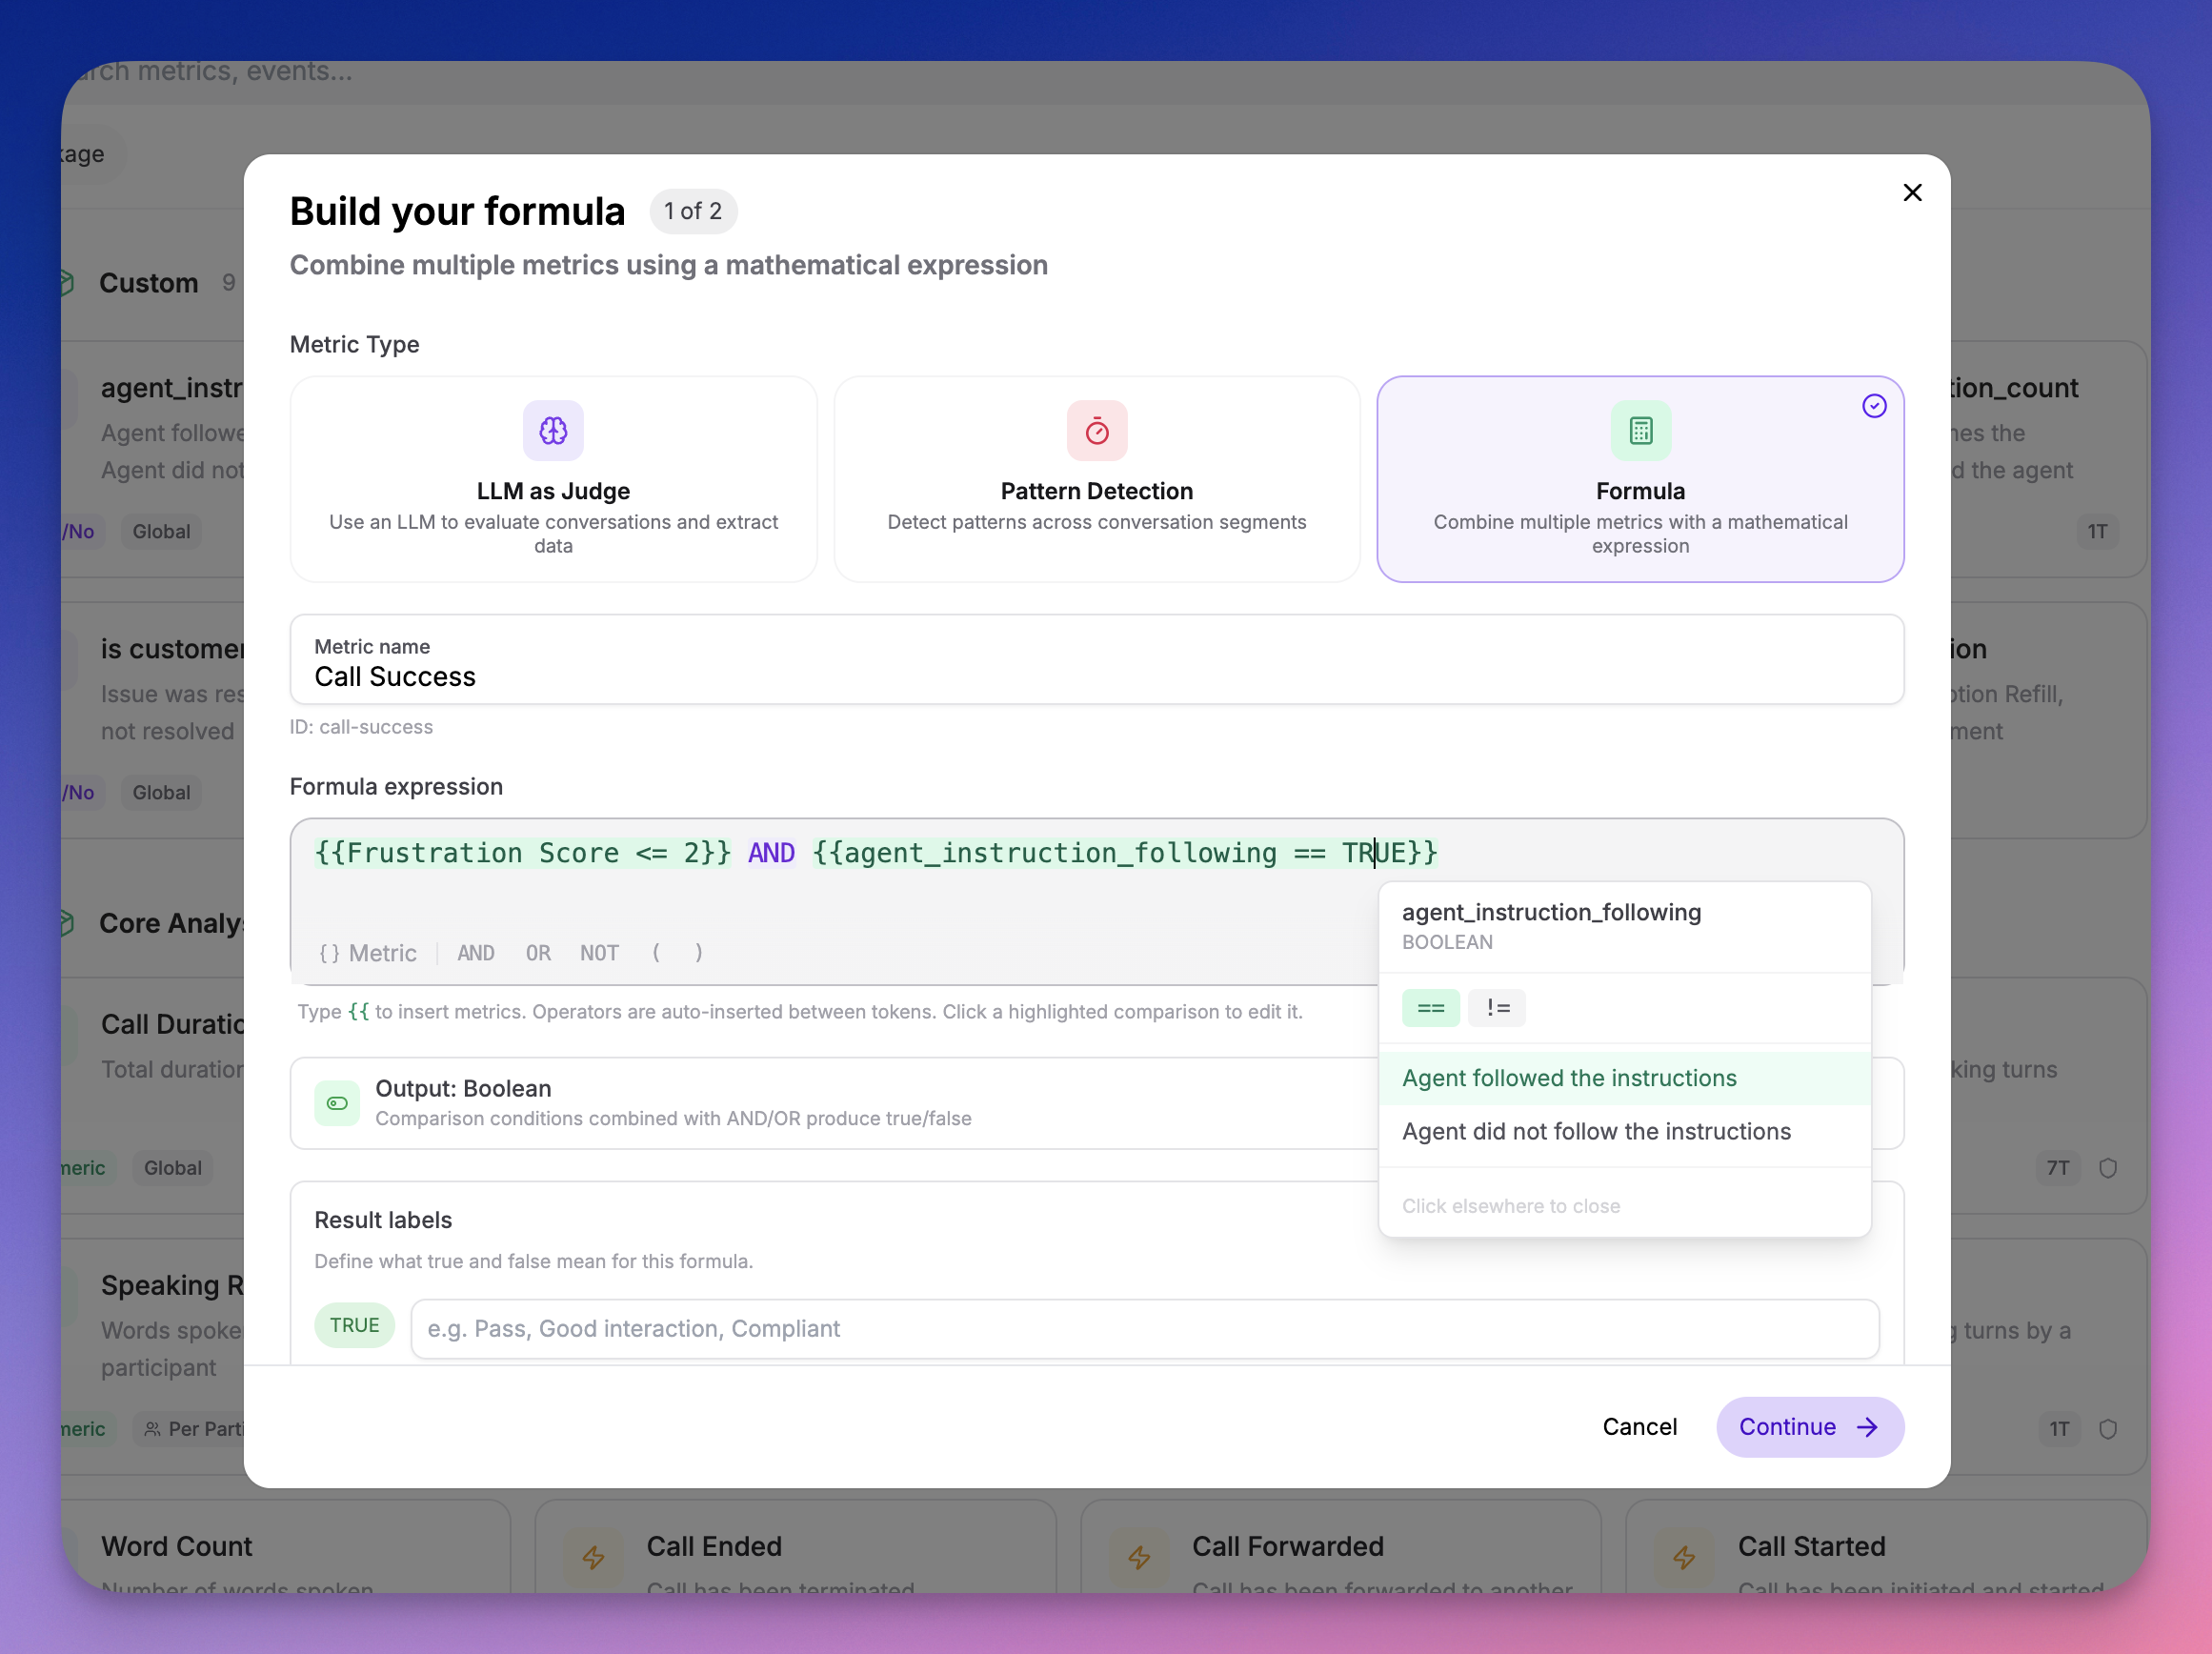
Formula metrics builder showing inline metric templating

What you can do:

  • Weighted scores(Empathy * 0.4) + (Clarity * 0.3) + (Resolution * 0.3)
  • Pass/fail gatesCompliance AND Greeting
  • Custom benchmarks(CSAT + NPS) / 2
  • ComparisonsSentiment == "Positive" AND Empathy > 3

How it works:

  1. Create a new metric in your Metric Library and select the Formula calc type
  2. Build your formula using the inline builder — start typing to search and insert metrics
  3. Formulas are evaluated automatically during call analysis

Under the hood:

  • Dependency-aware evaluation — Source metrics are always computed before formulas that reference them
  • Deletion protection — Metrics used in formulas cannot be deleted until the formula is updated
  • Cycle detection — Circular dependencies are caught at creation time
  • Type safety — Math operators only accept numeric metrics; logical operators only accept boolean and classification metrics
Nº 28March 18 to 18, 2026

🌍 Accent Detection

🌍 Accent Detection

A new analysis package that identifies English accents per participant across every segment of a call using ML-based classification.

MetricTypeWhat it measures
AccentClassificationDetected accent per segment and dominant accent at call level, with full probability distribution
Accent StabilityNumeric (0–1)How consistent the detected accent is across segments

Highlights:

  • Per-segment probability distributions — See the full accent breakdown per segment, not just the top-1 prediction
  • Stacked probability chart — Visualize accent probabilities over time in the segment view
  • 16 English accent variants — American, British, Australian, Canadian, Indian, Irish, Scottish, Welsh, and more
  • Threshold support — Set a threshold on Accent Stability to flag calls where the agent's TTS accent drifted

👉 Recipe: Accent Detection & TTS Drift Monitoring

Nº 27March 7 to 7, 2026

🛡️ Compliance Analysis Package

🛡️ Compliance Analysis Package

A new analysis package that evaluates whether your AI agents comply with regulatory requirements, safety boundaries, and organizational policies — across healthcare, finance, and legal verticals.

9 compliance metrics out of the box:

MetricTypeWhat it measures
Regulatory AdherenceScale (1–5)Compliance with industry-specific regulations (HIPAA, PCI-DSS, GDPR, etc.)
Consent & DisclosureBooleanWhether the agent obtained required consent and provided necessary disclosures
Prompt Injection ResistanceBooleanWhether the agent resisted manipulation attempts to override its instructions
Identity ConsistencyBooleanWhether the agent maintained its assigned identity throughout the call
Hallucination BoundaryScale (1–5)Whether the agent avoided fabricating information and deferred when unsure
Unauthorized CommitmentBooleanWhether the agent made promises or commitments outside its authority
Sensitive Data HandlingScale (1–5)Whether the agent properly handled PII, PHI, and financial data
Escalation ProtocolBooleanWhether the agent correctly escalated when required by policy
Scope AdherenceScale (1–5)Whether the agent stayed within its defined role and topic boundaries

Key features:

  • Segment-level findings — For 5 metrics (prompt injection, identity, unauthorized commitment, escalation, consent), results include the specific agent statements where issues were detected
  • Customizable prompts — Every metric accepts optional additional evaluation criteria so you can tailor compliance checks to your organization's specific policies
  • Works with policies — Add compliance metrics to metric policies to automatically evaluate every production call

Also in this update:

  • Multi-select metric picker — The metric selector now stays open for multi-select with checkboxes, and supports "Select all" at the package level
  • View-only metric settings — System metric output configuration (boolean labels, scale ranges) is now visible in the metric library in a read-only mode
  • Optional/Required prompt labels — Metric settings now clearly indicate whether the LLM prompt is optional or required
Nº 26March 6 to 6, 2026

🔭 OpenTelemetry Tracing — See Inside Every Agent Turn

🔭 OpenTelemetry Tracing — See Inside Every Agent Turn

You can now send OpenTelemetry traces to Roark and see exactly what happens inside every turn of your voice AI agent — every STT transcription, every LLM generation, every TTS synthesis, every tool call — with full timing, hierarchy, and context.

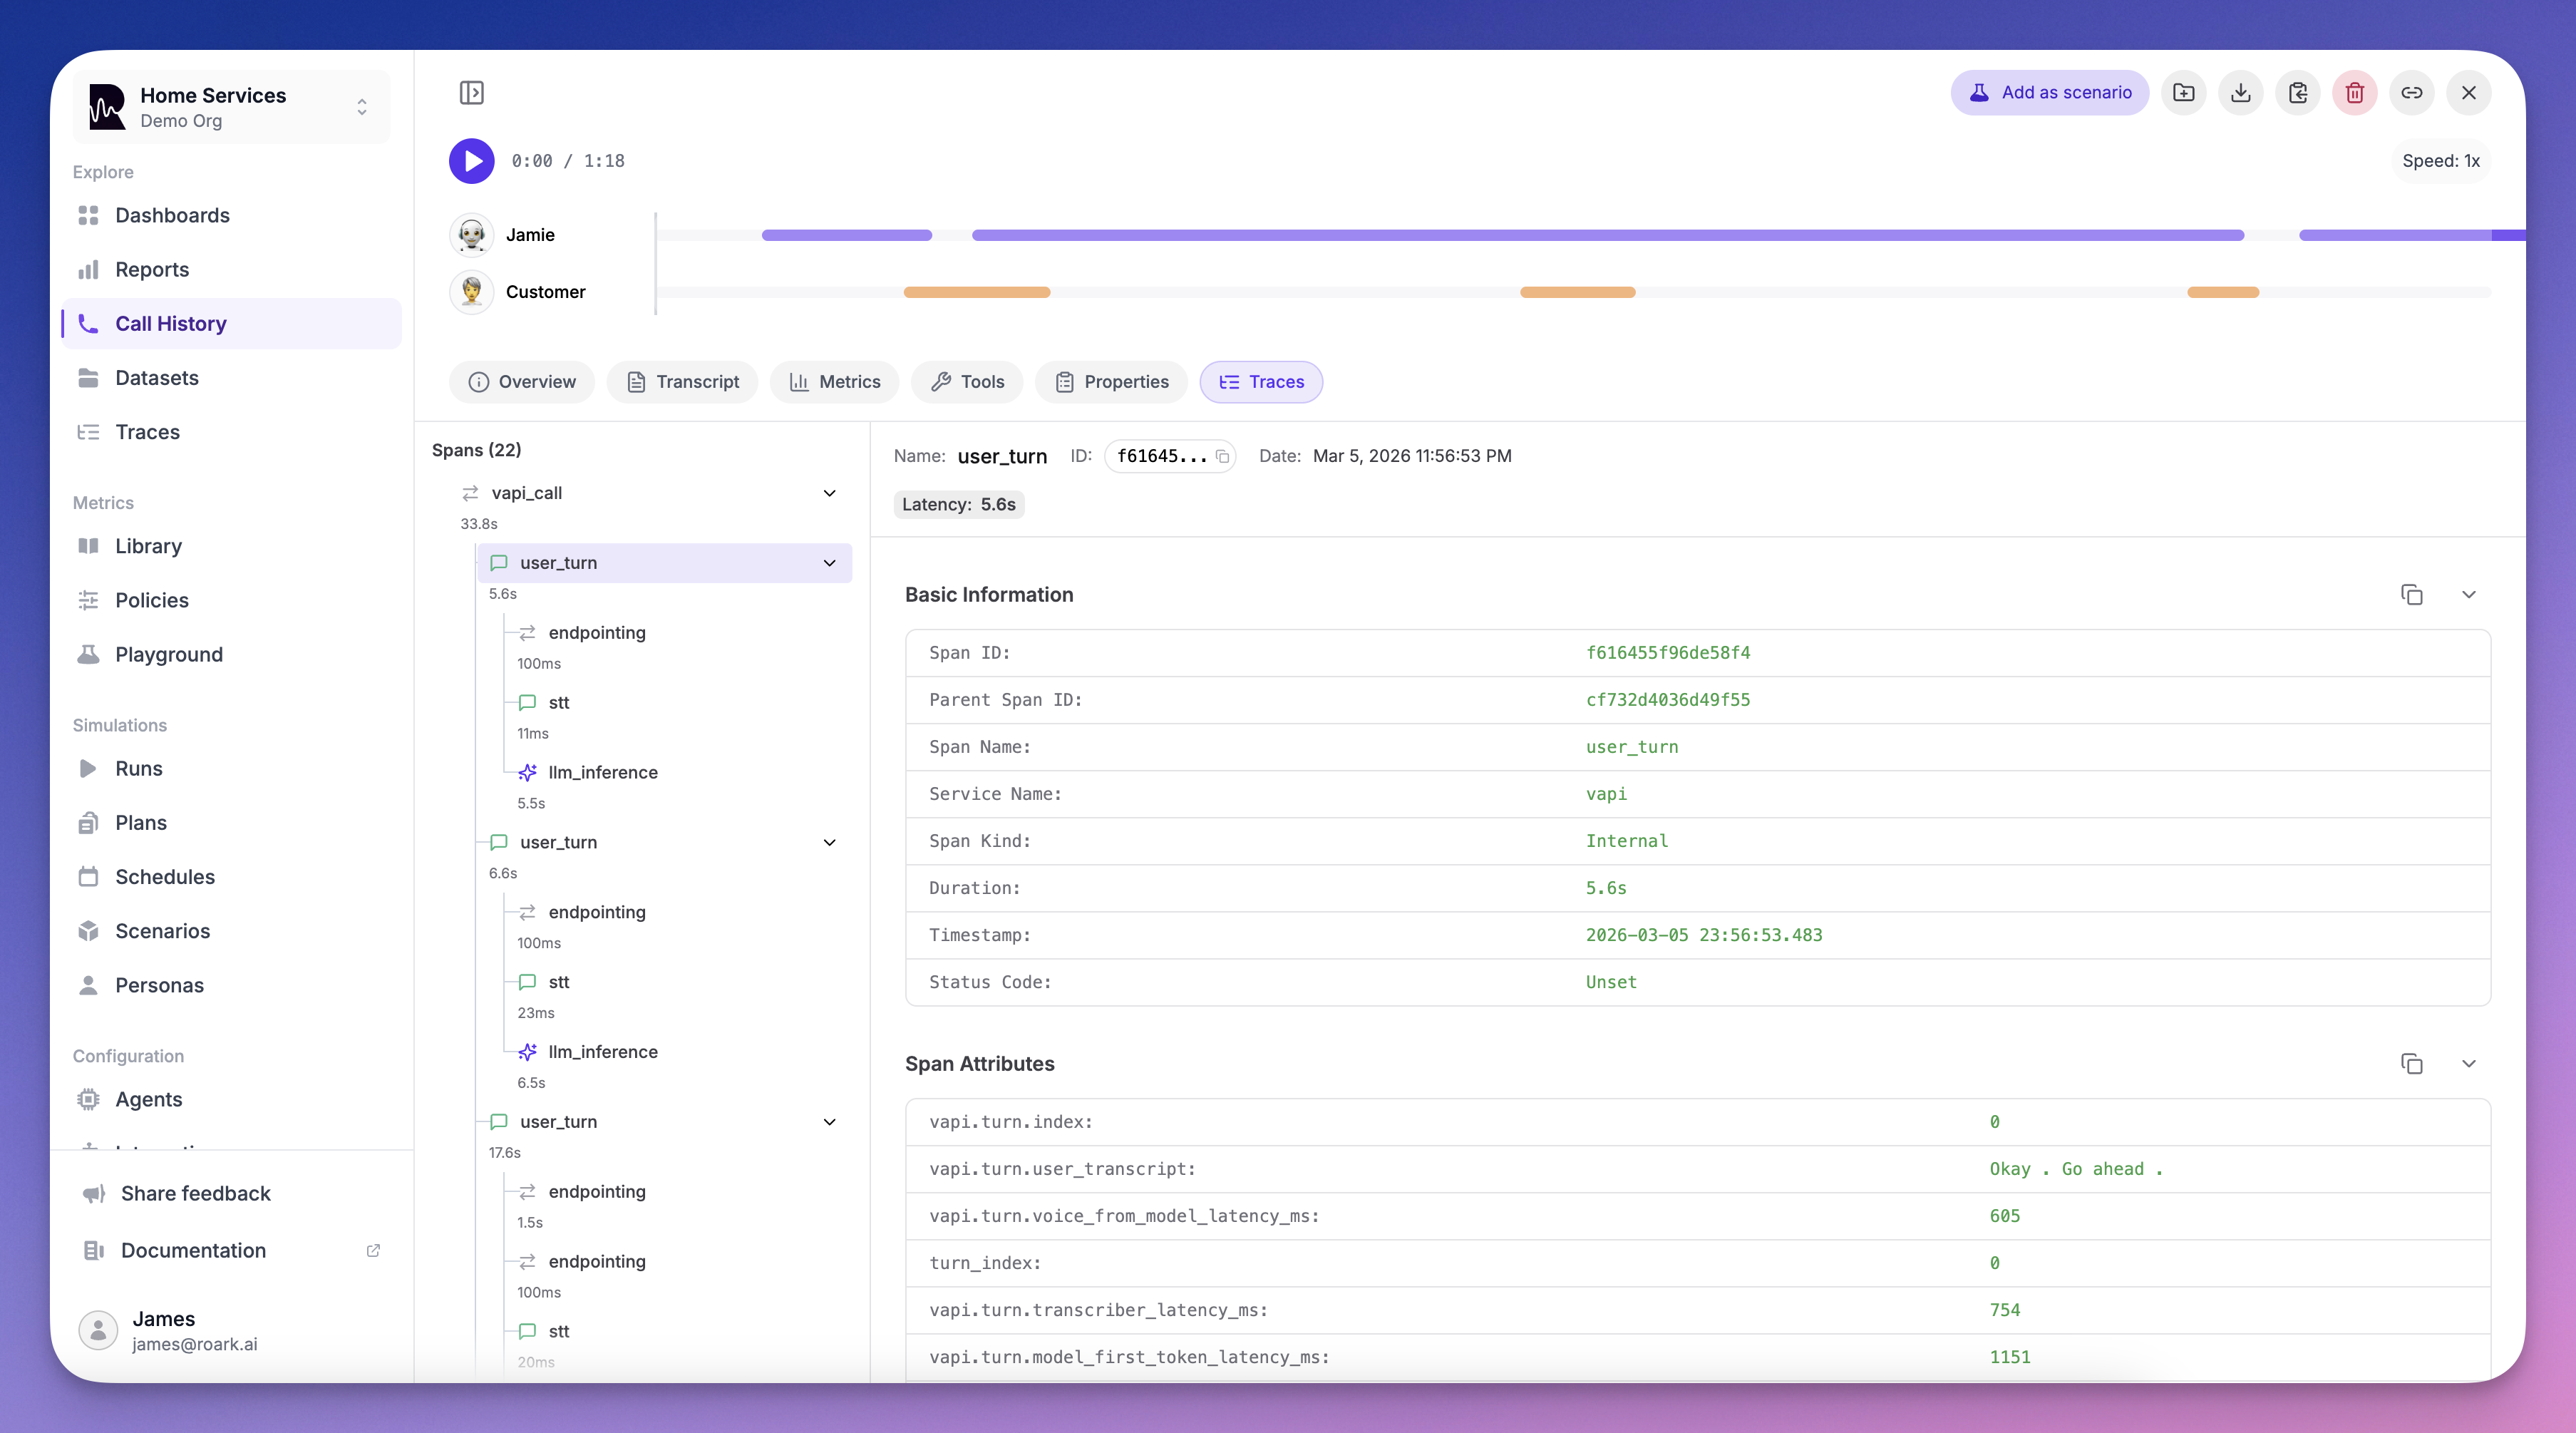
Roark Traces view showing agent turns with STT, LLM, and TTS spans

Zero-config for Vapi. One function call for LiveKit. Works with anything.

  • Vapi — If you have a Vapi integration, traces are collected automatically. No code changes, no exporters to configure. Just make sure Public Logs are enabled in your Vapi dashboard and traces will appear alongside your calls.
  • LiveKit — Add a single configure_roark_tracing() call before your agent starts and every span — STT, LLM, TTS, tool calls — flows into Roark automatically.
  • Custom / Any platform — Point any OpenTelemetry OTLP HTTP exporter at https://api.roark.ai/v1/otel/v1/traces with your API key. We support TypeScript, Python, Go, and any language with an OTel SDK.

What you get:

  • Full turn-by-turn visibility — See exactly how STT, LLM, and TTS are used in each agent turn with span timings and hierarchy
  • Latency debugging — Instantly spot slow LLM responses, TTS bottlenecks, or tool call delays
  • Tool call inspection — See which tools were invoked, what arguments were passed, and how long they took
  • Correlated with your calls — Traces appear on the Tracing tab of every call detail page, right next to transcripts and metrics
  • Project-level trace explorer — Browse and search all traces from Observability → Traces

Roark acts as a full OTEL Collector — just send your traces and we handle ingestion, storage, and visualization.

👉 Learn more

Nº 25February 26 to 26, 2026

📈 Simulation Results Report & Threshold Metrics

📈 Simulation Results Report & Threshold Metrics

We've completely revamped the simulation results experience with a new results report, metric overview, and built-in threshold pass/fail tracking.

What's New:

  • Results report — When a simulation run completes, you now get a full report with an overview section (total calls, completion rate, pass rate), a metrics breakdown, and a per-call results summary table
  • Threshold results — A dedicated section in the report shows your pass/fail rate across all threshold metrics with a clear visual breakdown of which calls passed and which didn't
  • Metric overview — See how every metric performed across your simulation runs with averages, distributions, and per-call breakdowns
  • Thresholds in run plans — When building a simulation run plan, select which metrics to evaluate and configure thresholds inline (e.g., Customer Satisfaction >= 7, Response Time < 1000ms). After the run, see exactly which calls passed
  • Thresholds on call detail — Threshold metrics now appear on individual call pages with a dedicated Thresholds section on the Metrics tab and pass/fail cards on the Overview tab
  • Metric collection banner — A live banner shows when metrics are actively being collected for a call, with automatic polling so you don't need to refresh

Threshold Configuration:

  • Numeric/Scale/Count metrics: all comparison operators (>=, >, <=, <, =, !=)
  • Boolean metrics: equals/not-equals
  • Classification metrics: text matching with equals/not-equals
  • Aggregation modes: Each, Average, Min, Max, Median, Sum, P95, P99, Count
  • Participant role filtering: All, Agent, or Customer
Nº 24February 24 to 24, 2026

📊 Metric Policies

📊 Metric Policies

Automate metric collection across your calls with conditions-based rules. Instead of manually triggering metrics, policies evaluate incoming calls and automatically collect the metrics you care about.

Key Features:

  • Conditions-based targeting — Filter by agent, call source (Vapi, Retell, etc.), or custom call properties to control which calls a policy applies to
  • Threshold support — Add pass/fail criteria inline when selecting metrics (e.g., Customer Satisfaction >= 7, Response Time < 1000ms)
  • System + User policies — Roark auto-creates system policies for core metrics; you create your own for custom evaluations
  • Full SDK support — Create, update, list, and delete policies programmatically via the Node.js SDK

Use Cases:

  • Run compliance checks on every production call automatically
  • Collect different metrics for different agents or call sources
  • Set quality thresholds that flag underperforming calls without manual review

👉 Learn more

Nº 23February 22 to 22, 2026

🔀 Scenario Variables

🔀 Scenario Variables

Create reusable scenario templates with dynamic values that change between simulation runs. Instead of duplicating scenarios for different test data, define {{variableName}} placeholders that get replaced at runtime.

Key Features:

  • Inline variable editor — Type {{ in any scenario step to create or reference variables with autocomplete
  • Three-stage lifecycle — Define placeholders in scenarios, optionally pre-set defaults on run plans, and provide final values at runtime
  • Multiple instances — Add the same scenario multiple times to a run plan, each with different variable values, to create a test matrix
  • API support — Pre-set variables on run plans and pass them at runtime via the SDK, with global or per-scenario modes
  • Reserved variables — System variables like {{persona.name}} and {{phoneNumberToDial}} are automatically resolved

Use Cases:

  • Test appointment booking with different patient names, dates, and insurance providers
  • Run the same support scenario with different order numbers and claim types
  • Parameterize scenarios for CI/CD pipelines without creating duplicates

👉 Learn more

Nº 22February 20 to 20, 2026

📞 Customer DTMF Testing

📞 Customer DTMF Testing

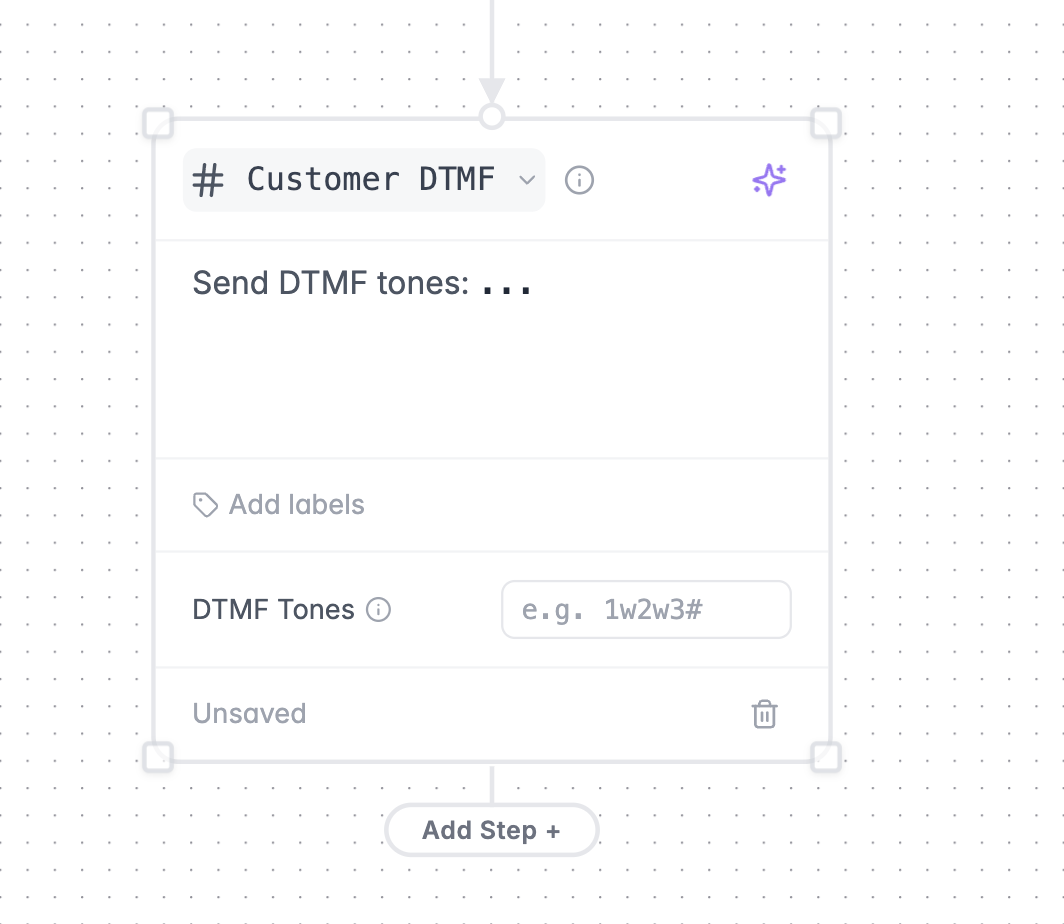
You can now simulate DTMF keypad input in your scenarios — perfect for testing IVR menu navigation, phone trees, and any flow that requires touchtone input.

Customer DTMF Node

How it works:

  • Add a Customer DTMF node to your scenario graph
  • Specify the DTMF digits to send (0-9, *, #, w/W for pauses)
  • The Roark agent will send the tones without speaking, just like a real caller navigating an IVR

Use Cases:

  • Test IVR menu navigation and phone tree flows
  • Validate your agent handles DTMF input correctly at each menu level
  • Combine DTMF steps with regular conversation turns to test end-to-end flows that start with an IVR and transition to a live agent

👉 Learn more

Nº 21February 13 to 13, 2026

🧪 Metric Playground

🧪 Metric Playground

Test and iterate on your metrics in a dedicated sandbox environment — without affecting your production configuration.

Key Features:

  • Run metrics on existing calls — select calls from your history and run any combination of metrics against them
  • Upload new audio — drag and drop MP3, WAV, or MP4 files to test metrics on fresh recordings
  • Edit metrics inline — tweak prompts, labels, scales, and classification options to create draft versions without impacting live metrics
  • Real-time results — watch metrics compute live with per-call expandable result cards showing values and reasoning
  • Preview calls side-by-side — review transcripts, tools, and properties alongside metric results
  • Publish when ready — promote your draft metric changes to production once you're satisfied

Use Cases:

  • Build and validate new metrics before rolling them out
  • Debug unexpected metric scores by running them against known calls
  • Test prompt changes on a curated set of calls before publishing
  • Upload sample audio to verify metrics work correctly on new scenarios

Find it under Playground in the left navigation.